|

|
Working with Logarithms |
|
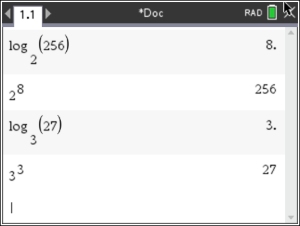
A logarithm is an
exponent.
|
As this example shows, 3 is the
exponent to which the base 2 must be raised to create the answer of 8,
or 23 = 8. In general terms:
(where x > 0 and
b is a positive constant
not equal to 1) |
|
Beware of Graphs:
|
|

Don't confuse log graphs
with square root graphs.
At fist glance, these two graphs appear to be similar. But the square root graph is actually ending, while the log graph is not. |
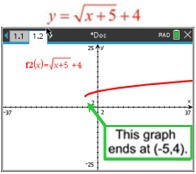 |
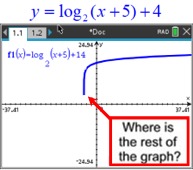
| On the logarithmic graph above, the calculator is "trying" to plot points on the graph to the left. But the graph is SO CLOSE to its vertical asymptote of x = -5, there is no room to put additional pixels before it crosses over the asymptote. Plotting points "straight" down would violate the graph being a function, and f (x) on the TI-Nspire plots functions. The logarithmic graph continues downward toward negative infinity approaching the asymptote x = -5. (Graphing it as a "relation" won't help.) |
Types of Logarithms:
BASE 10: Logarithms with base 10 are called common logarithms.
When the base is not indicated, base 10 is implied.
On the graphing calculator, log (above the key 10x) will open the log template to calculate the
common (or base 10) logarithm.
The key 10x will calculate the antilogarithm.
|
|
|
OTHER BASES:
Other bases are treated in the same manner as base 10.
Simply use the desired base number when filling in the log template for log (above the key 10x ).
These new number bases are not referred to as common logarithms. That expression is used only for base 10.
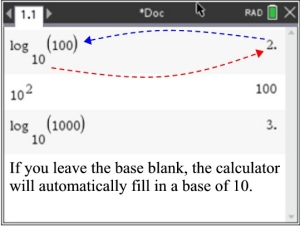
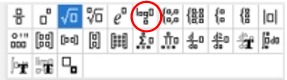
You can also use the template key  to get the chart shown at the right. The sixth entry from the left, on the top, gives the log format. to get the chart shown at the right. The sixth entry from the left, on the top, gives the log format. |
|
|
BASE e:
Logarithms with base e are called natural logarithms.
Natural logarithms are denoted by ln.
On the graphing calculator, ln (above the key ex) will open the function to calculate the
natural (or base e) logarithm.
(The base e is implied and will not be entered as the base, as it is the ONLY possible base for ln.)
|
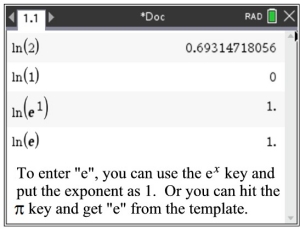
You need to KNOW that
ln(1) = 0 and ln(e) = 1
|
|
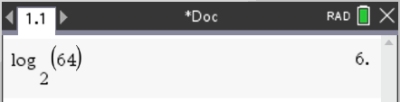
| 1. Evaluate: log2 64 |
|
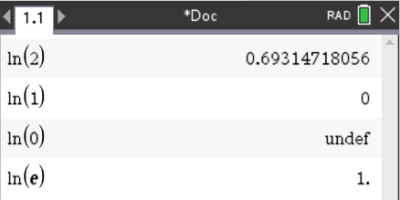
2. Evaluate: ln 2; ln 1; ln 0, ln e
|
|
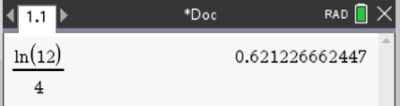
3. Evaluate: 
|
|
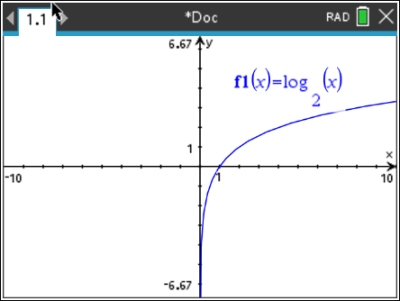
4. Sketch the graph of f (x) = log2 x
Notice that the logarithmic graph has a vertical asymptote at x = 0 (the y-axis).
The domain of the parent logarithmic graph is x > 0.
|
 |
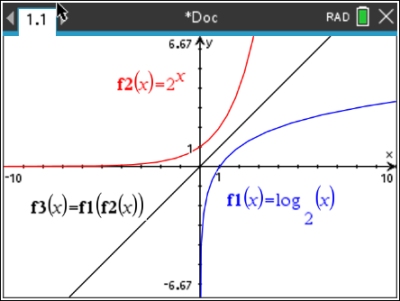
5. Use a graph to support the conclusion
that the inverse of f (x) = 2x is
f -1(x) = log2 x.
A function composed with its inverse creates the
identity line y = x. Showing that the
composition of these two functions is the identity line shows
that these functions are inverses of one another. Note: after graphing the composition, you can double check that the identity line was created by graphing f4(x) = x. Using
bubble animation (-o) set for f4 will show that f4 overlaps f3.This will establish that f1(f2) = x (the Identity Function). |
Get the variables f1 and f2 under the VAR key.
|
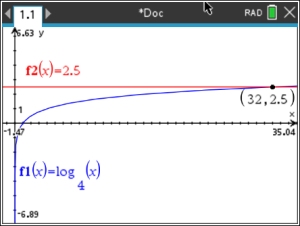
6. Solve graphically: log4 x = 2.5
Method 1: Graph each side separately.
The window must be
adjusted to show a sufficient amount of the x-axis to locate the
intersection point. Use the Intersection (MENU, 6,4) option to find the answer is
x = 32.
 |
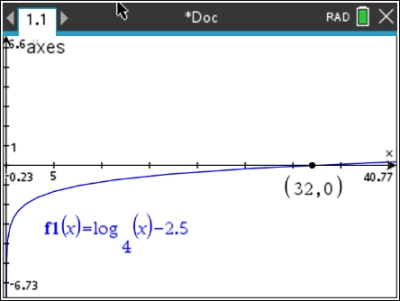
Method 2: This problem can also be solved by setting the
equation equal to 0 and finding the x-intercepts, or
zeros (MENU, 6, 1), of the function. Function: log4x - 2.5 = 0
Zero at x = 32.
 |
7. Using your graphing calculator,
determine which of the following statements are true.
|
a.) T b.) F c.) F
d.) T e.) F f.) T |
|
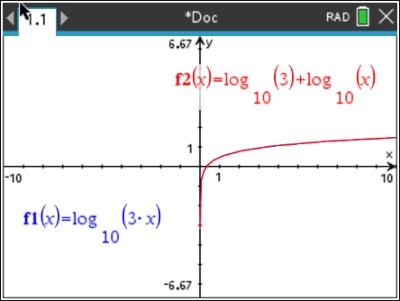
Solution for part a: (TRUE)
Place the left side of the equation in f1 and the
right side in f2. Turn on the "bubble
animation" for f2. This
will allow you to see the bubble floating over the graph of f1 when
the equation is true. Parts b - f are solved in a similar
manner. Note that the red graph covered up the blue graph.
|
|

Table of Contents | MathBits.com | Terms of Use
|